Most service businesses are still judging crew performance the same way they did a decade ago: gut feel, paper logs, or a spreadsheet someone updates when they remember. A 2018 survey covered by the National Roofing Contractors Association found that 47% of construction managers relied on manual methods to collect project information — and for many field service businesses, that habit hasn't changed much since.
This article breaks down what crew performance analytics actually means and five practical ways it improves project efficiency, without turning your business into a surveillance operation.
KEY TAKEAWAYS
- Estimated vs. actual job time reveals which crews or phases slow you down.
- Event-based geolocation tracking closes the gap between billed and worked hours.
- Per-crew job costing shows which teams are most profitable, not just busiest.
- Real-time dashboards let dispatchers catch schedule problems before jobs get missed.
- Comparing crews only works when the jobs are genuinely alike, so job type and site conditions belong alongside the numbers.
What Is Crew Performance Analytics?
Crew performance analytics is the practice of collecting and analyzing field data (hours worked, job completion rates, costs, and location) to measure how crews perform against project goals.
Rather than grading individual workers, it focuses on operational patterns: which crews finish on time, which job types run over budget, and where the bottlenecks actually live.
This differs from a traditional HR performance review. HR evaluations tend to be periodic, subjective, and focused on the individual, while crew performance analytics is continuous, team-level, and built from operational data rather than opinion.
That said, the two aren't unrelated. Objective field data gives HR a fairer basis for coaching or accountability conversations than secondhand impressions alone.
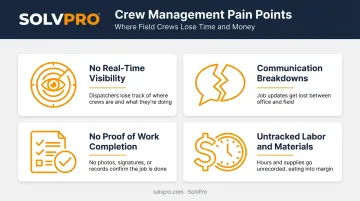
For field service and construction businesses running several job sites at once, this matters more than it does almost anywhere else. Common pain points include:
- No real-time visibility into which crews are active, delayed, or done without calling every foreman.
- Communication breakdowns between the office and the field.
- No proof of work completion at each site.
- Untracked labor and materials, which erode margins job after job.
Types of Crew Performance Analytics You Should Track
Not all analytics answer the same question. Applied to crews, there are four core types worth knowing:
| Analytics Type | What It Answers | Crew Application |
|---|---|---|
| Descriptive | What happened? | Completed jobs, hours logged, costs, callbacks |
| Diagnostic | Why did it happen? | Why a crew or job type ran over budget |
| Predictive | What's likely next? | Forecasting completion dates or callback risk |
| Prescriptive | What should we do? | Reassigning crews, adjusting schedules |
Beyond the analytics type, focus on the data categories that actually reveal crew performance:
- Time and attendance: hours worked versus hours scheduled
- Geolocation and movement data: proof of arrival, presence, and departure
- Job costing: labor, materials, and time against invoiced amounts
- Quality and callback data: rework frequency tied to specific jobs or crews
Here's the trap growing service businesses fall into: tracking everything. A dashboard with 40 metrics is functionally useless. Pick 3 to 5 core metrics tied directly to profitability and efficiency. Job completion variance, labor cost per job, and callback rate cover most of what matters for a business under 50 employees.
5 Ways Crew Performance Analytics Improves Project Efficiency
Track Job Completion Times to Spot Bottlenecks before They Cost You
Comparing estimated versus actual completion time, broken down by crew and by job phase, tells you exactly where a project slows down. Not "the job ran late," but which phase, which crew, and by how much.
This matters more than most owners realize. McKinsey's construction research points to a typical schedule overrun of around 20% on large construction projects, against an industry average EBIT margin of roughly 5%. A schedule slip of that size doesn't just delay a job. It puts real pressure on a margin that was already thin.
Picture a landscaping crew that consistently runs long on hardscape installs but finishes on time for planting jobs. Without phase-level data, that pattern is invisible: you just know "installs run late." With it, you know exactly where to add labor or rebuild the estimate.
Use Geolocation and Time Tracking for Real Accountability
Hours billed and hours actually worked aren't always the same number. Event-based geolocation tracking (capturing location at clock-in, job-site arrival, and clock-out) closes that gap without requiring anyone to watch a live GPS feed all day.
SolvPro builds this in as event-based geolocation tracking, geo-stamping time entries, photo uploads, and activity logs at the moment they happen. It's a meaningful difference from always-on tracking: crews aren't being monitored continuously, but every key event has a verifiable record attached to it.
The upside cuts both ways:
- Office staff stop guessing whether reported hours match reality.
- Crews get proof of their own work, which protects them from disputes too.
- Trust improves because the data is transparent, not punitive.
Monitor Job Costing and Profitability by Crew
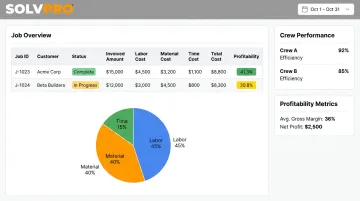
Tracking labor, material, and time costs against invoiced amounts per job reveals something a lot of owners assume they already know but usually don't: which crews and job types are genuinely profitable.
Reliable cost data also has to move fast to be useful. FMI's 2023 Labor Productivity Study found that 78% of contractors with "extremely reliable" cost-to-complete information received productivity feedback daily or weekly, not monthly and not at project close-out.
SolvPro's job costing tracks labor, materials, and project timelines at the job level in real time, then surfaces crew performance and profitability side by side on one dashboard. That means:
- Managers can see which crews consistently deliver margin, not just volume.
- Top-performing crews can be routed to higher-margin work.
- QuickBooks Online sync keeps that cost data connected to your books without duplicate entry.
Analyze Callback and Rework Rates to Protect Quality
A crew that finishes fast but generates repeat callbacks is just shifting cost downstream, not eliminating it. Tracking rework and callback frequency per crew surfaces training gaps or process breakdowns before they damage your reputation with a customer.
Quality metrics are most valuable when paired with context, not viewed alone. A crew with a higher callback rate might simply be assigned the most complex jobs, or be stretched across too many sites in a week. Tie callback data back to scheduling load and job complexity, and you find the root cause instead of just the symptom.
Photo documentation, field notes, and customer sign-off (all standard parts of a digital work order) give you the raw material to build this picture, even without a dedicated callback module.
Use Real-Time Dashboards to Adjust Schedules and Staffing on the Fly
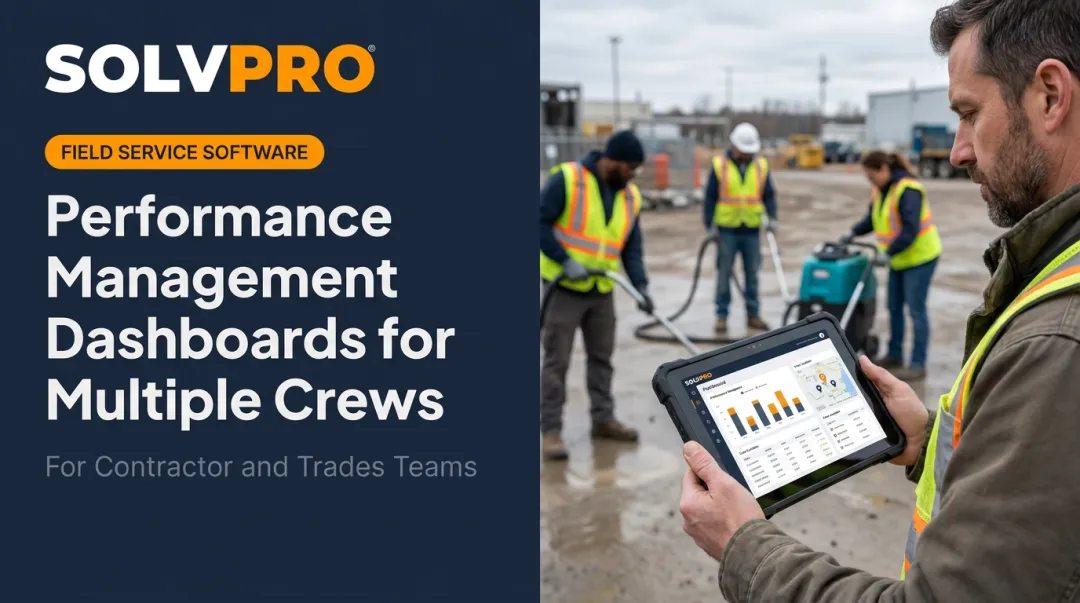
A live dashboard showing crew status and job progress lets a dispatcher react in minutes instead of finding out about a problem at 5 p.m. If a crew falls behind, another can be reassigned before a second job gets missed entirely.
There's a payment benefit hiding in this too. When a job is marked complete in real time, the office can invoice immediately instead of waiting for paperwork to trickle in at the end of the week. SolvPro's platform is built around this exact chain: field crews update status on-site, office staff see it instantly, and invoices go out the same day instead of sitting in a backlog.
Overcoming Common Challenges When Adopting Crew Analytics
Analytics tools fail for predictable reasons. Here's how to avoid the common ones:
- Data fragmentation. Paper logs, standalone scheduling apps, and separate invoicing tools rarely talk to each other. A platform like SolvPro that centralizes scheduling, work orders, and invoicing fixes this at the source.
- Crew resistance. Field crews often hear "analytics" and think "surveillance." Frame it as a support tool, not monitoring, and let crews weigh in on which metrics matter.
- Metric overload. Tracking 20 KPIs guarantees none get acted on. Focus on a handful tied directly to efficiency and profitability, then revisit that list quarterly.
How SolvPro Simplifies Crew Performance Analytics for Growing Service Businesses
SolvPro combines scheduling, work orders, crew tracking, and payments into one platform, so performance data doesn't live scattered across five disconnected systems. When a job is scheduled, the system automatically creates a digital work order. When a crew logs time or materials, that data feeds straight into job costing. No one has to re-enter it by hand.
That automation shows up in a few specific features:
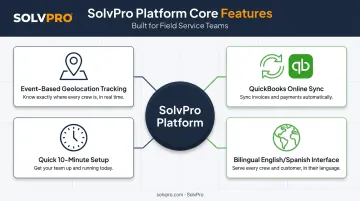
- Event-based geolocation tracking and phase-based estimating turn raw field data into decisions you can act on, not just numbers on a screen.
- QuickBooks Online sync connects job completion data directly to invoicing, so finishing a job faster actually means getting paid faster.
- Setup takes under 10 minutes, with free live onboarding support instead of a 40-page manual.
- A bilingual English/Spanish interface means every crew member logs accurate data, regardless of which language they work in.
If your crews are still running on spreadsheets and phone calls, booking a free demo is a low-risk way to see how much of that chaos disappears once the data lives in one place.
Frequently Asked Questions
What Is Crew Performance Analytics and How Does It Help HR?
It's the practice of using field data, including hours, locations, and job outcomes, to measure crew output objectively. That gives HR bias-free evidence for accountability, coaching, and staffing decisions instead of relying on memory or opinion.
What Are the Main Types of Analytics Used in Crew Performance Analytics?
Descriptive analytics shows what happened on a job, diagnostic explains why, predictive forecasts staffing or completion needs, and prescriptive recommends specific scheduling or resource actions.
What Are the 7 Pillars of People Analytics?
Common frameworks cite workforce planning, sourcing, hiring, onboarding and engagement, retention, performance and development, and employee wellness. For field crews, these translate into staffing forecasts, training gaps, and safety data.
How Often Should You Review Crew Performance Data?
Review active jobs and blockers daily through quick check-ins. Pair that with weekly reviews of completion rates and costs, plus monthly or quarterly reviews for bigger strategic decisions.
What's the Difference Between Crew Performance Analytics and Traditional Performance Reviews?
Crew analytics is continuous and based on team-level operational data. Traditional reviews are periodic, individual-focused, and largely subjective, based on a manager's impressions rather than logged data.
Can Small Crews or Growing Service Businesses Benefit from Performance Analytics Software?
Yes. Even a two- or three-crew operation gains from tracking a handful of core KPIs. Affordable, fast-to-set-up platforms make this practical without an enterprise budget or IT department.