Picture a general contractor running four crews on four different job sites on a Tuesday morning. The office has a whiteboard, a group text thread, and a lot of guesswork.
Nobody can say for certain which crew is on schedule, which one is running behind, or whether Job #3 is actually making money.
This is the daily reality for most multi-crew field service businesses. Text messages replace status reports. Spreadsheets get updated a day late, if at all. By the time a problem surfaces, it's already cost real hours and real dollars.
Construction leaders lose more than 14 hours a week to non-optimal work, according to FMI and PlanGrid's 2018 survey of 599 construction leaders. That includes hunting for project data and cleaning up mistakes caused by poor communication. That's nearly two full workdays gone.
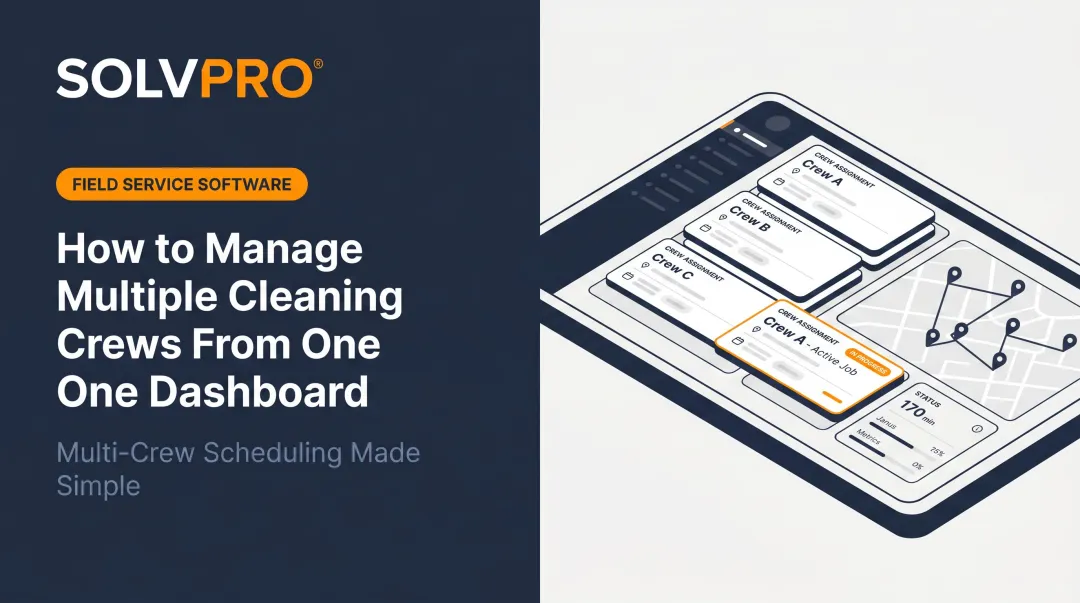
Fixing that starts with knowing exactly what's happening in the field. This post breaks down the metrics that actually matter for multi-crew dashboards, how to build one, and how SolvPro pulls crew data into one live view.
KEY TAKEAWAYS
- A multi-crew dashboard centralizes scheduling, attendance, and profitability into one live view
- Crew performance depends on job completion, on-time arrivals, and labor cost vs. revenue, not app usage
- Spreadsheets and generic project tools break down once you manage more than a couple of crews
- Platforms like SolvPro combine crew tracking, scheduling, and payments so staff aren't reconciling five systems
- A dashboard is only as current as the field data behind it, so how crews record time decides whether the view can be trusted
What Makes Performance Management Different for Multi-Crew Field Service Businesses
Most performance dashboards were built for a different kind of worker.
Office and remote employee tools track app usage, screen time, and keystrokes. None of that applies when your team is pouring concrete, running electrical conduit, or mowing a commercial property three towns over.
Multi-crew field service businesses (electrical, plumbing, landscaping, general contracting, excavation) face a different visibility problem. Work happens across dozens of scattered locations, not one office or a single shared project file. Each job site is its own small operation with its own schedule, budget, and risks.
A crew dashboard needs to answer three questions, fast:
- Which crews are on schedule right now?
- Which jobs are actually profitable?
- Where is a bottleneck forming before it becomes a delay?
The Accountability Gap
Without a dashboard, office staff rely on phone calls and texts to confirm crew status. That gap creates real problems:
- Delayed answers when a customer calls asking if their crew is still coming
- Miscommunication between what a crew lead reports and what actually happened on-site
- Paperwork that gets lost somewhere between the truck and the office
The cost adds up quickly. Construction leaders spend 5.5 hours a week just finding project data and another 4.7 hours resolving conflicts caused by that missing information, based on FMI and PlanGrid's research cited above. Multiply that across a team managing four or five crews, and status-checking alone eats up a full workday every week.
Separately, field-to-office communication was named a major IT challenge by 36% of contractors surveyed by AGC in 2025. This structural problem stems from generic tools that weren't built for scattered crews, which is why the metrics below look different from a typical office dashboard.
Essential Metrics Every Multi-Crew Performance Dashboard Should Track
An effective dashboard doesn't try to track everything. It focuses on a handful of numbers that answer one question: are we on schedule, on budget, and doing quality work? Everything else is noise.
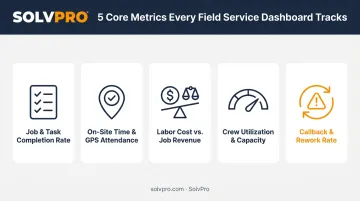
Here are the five that matter most.
Job & Task Completion Rate by Crew
This is the percentage of scheduled jobs each crew finishes on time. Tracking it side by side across crews does two things: it surfaces your top performers, and it flags crews that need more support, more training, or a lighter schedule.
A crew that's consistently behind isn't necessarily a bad crew. They might be overloaded, understaffed, or working jobs that were underscoped from the start.
On-Site Time & GPS-verified Attendance
Job and crew time tracking clock-in/out data shows actual arrival and departure times against the scheduled window. This flags late starts, early departures, or extended lunch breaks across every job site at once, without anyone making a phone call to check.
Labor Cost vs. Job Revenue (Profitability per Crew or Job)
This is a metric that is easy to get wrong: tracking labor hours and costs against invoiced revenue per job. It reveals which crews, job types, or clients are actually profitable, and which ones are silently losing money.
The stakes are real. FMI's 2023 Labor Productivity Study found that a 6% productivity improvement can boost profitability by an average of 50%. Small shifts in labor efficiency have an outsized effect on the bottom line.
Crew Utilization & Capacity
Comparing scheduled hours to available hours per crew shows two failure modes at once: overbooked crews risk delays, burnout, and rushed work, while underutilized crews represent capacity you're paying for but not using.
Neither failure mode shows up clearly until hours get logged consistently by job and by crew member.
Callback & Rework Rate
Tracking how often a crew has to return to fix or redo a job signals a quality problem before it becomes a reputation problem. Rework isn't cheap either. Research from the Construction Industry Institute found field rework averaging above 3% of construction-phase cost across more than 150 heavy-industrial projects.
Left untracked, callbacks quietly erode both profitability and customer trust.
Why Spreadsheets and Generic Tools Break Down with Multiple Crews
Spreadsheets work fine for one crew and one job site. Add a second, third, or fourth crew, and the cracks show up fast.
The core problem is manual entry. Someone has to text, call, or physically bring information back to the office before a spreadsheet reflects reality. By the time that happens, the data is already stale, and teams make decisions based on yesterday's information.
Generic project management or office-employee dashboards don't fix this. They weren't built for job-site realities like:
- Travel time between sites
- GPS-verified attendance
- Multi-stage job costing tied to work actually completed
Disconnected systems make it worse. Separate tools for scheduling, timesheets, and invoicing force office staff to manually reconcile data across platforms. That process:
- Eats into admin time better spent elsewhere
- Invites costly billing errors from re-entered data
- Slows down accurate job costing
This isn't a small issue. When construction apps don't integrate, 49% of teams end up transferring data manually and 44% fall back on spreadsheets anyway, according to JBKnowledge's construction technology survey. The tools meant to save time end up creating a second job: data entry.
For a business running four crews, that second job can easily consume a full-time position's worth of hours every month.
How to Build a Performance Management Dashboard for Your Crews
Building a dashboard doesn't require an IT department, just a clear process.
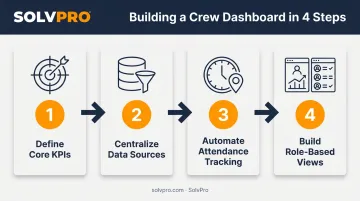
- Define the KPIs that actually matter. Resist the urge to track everything. Start with three: job completion rate, labor cost vs. revenue, and on-time arrival. Layer in utilization and rework tracking once these three are running reliably.
- Centralize your data sources. A dashboard is only as good as the data feeding it. Centralize crew scheduling, time tracking, and job data into one system so it pulls from a single source of truth, not five spreadsheets and three apps.
- Automate attendance tracking. Set up geolocation-based clock-in/out for each crew and job site so attendance data populates itself; if someone has to manually log it, it will eventually stop getting logged accurately.
- Build role-based views. Office managers need to see every crew and every job's profitability, while crew leads generally only need their own schedule and job list. Building both views into the same platform keeps everyone focused on what's relevant to their job.
Features to Look for in Crew Performance Software
Not every field service tool is built the same way. When evaluating software, look for:
- Real-time updates from the field, so status changes appear in the office the moment they happen, not at end of day
- Mobile-first design, since crews need something they'll actually use on-site, not a desktop dashboard built for a different kind of worker
- Built-in invoicing and payment integrations, like a QuickBooks Online sync, so profitability numbers stay tied to real costs and revenue instead of estimates
Skipping any of these three usually means someone ends up re-entering data by hand, which defeats the point of having a dashboard in the first place.
How SolvPro Helps You See Where Every Crew Stands
SolvPro was built by people who've actually worked job sites, trucks, and job trailers, not in a boardroom. That shows up in how the platform handles multi-knowing where crews are assigned.
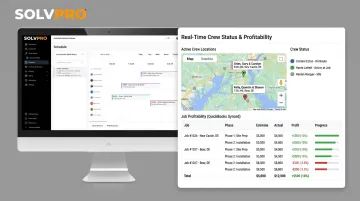
Job and crew time tracking shows exactly when and where each crew clocks in and out. Time entries, photos, and activity logs are recorded against the job automatically, creating a transparent record across every active job site without a single phone call to confirm it.
Rather than juggling separate tools for dispatching, timesheets, and invoicing, SolvPro brings scheduling, work orders, crew tracking, and payments into one platform. Office staff see which crews and jobs are active, delayed, or complete in real time, and can respond to issues immediately instead of piecing together updates from five different systems.
Profitability tracking runs through SolvPro's digital estimates feature. Contractors build customer-facing PDF proposals broken into project phases, and once a customer approves and signs, the estimate converts instantly into an active job. From there, actual labor and material costs track against that original estimate, and the numbers sync with QuickBooks Online so profitability reflects reality, not guesswork.
Beyond tracking profitability, the platform adapts to how each crew actually works. For teams managing multiple crews across different trades—electrical, plumbing, landscaping, and general contracting—job types and crew permissions are customizable rather than one-size-fits-all.
Two more things make this practical for busy multi-crew teams:
- Bilingual English/Spanish interface across the entire platform, mobile app included, so language never becomes a barrier between office and field
- Setup in under 10 minutes, with live onboarding support instead of a lengthy implementation cycle
- No long-term contracts, so teams can scale up or down without being locked into a rigid agreement
SolvPro runs a single core plan rather than tiers, and does not publish pricing. The core plan includes the full analytics suite—job profitability, crew performance reporting, and QuickBooks sync—with no add-on fees.
Conclusion
You shouldn't have to wait until the job is over to find out whether you made money.
Keeping the estimate, work order, time entries and invoice on one record reduces how much the office has to reconstruct before it can bill. That is the difference between finding out now and finding out at closeout. When you want to see it on your kind of work, Book a Demo.
Run the Job. Protect the Profit.
Frequently Asked Questions
What Is a Performance Management Dashboard for Multiple Crews?
It's a centralized, live view combining scheduling, attendance, job progress, and profitability data across all your field crews in one place, replacing scattered texts, calls, and spreadsheets.
What Metrics Should I Track First If I'm Managing Multiple Crews?
Start with job completion rate, on-time arrival, and labor cost vs. revenue. These three give you the clearest picture of schedule and budget health before adding more advanced metrics.
How Is Tracking Crew Performance Different from Tracking Office Employee Performance?
Crews work across scattered job sites rather than one location, so dashboards rely on GPS and job-based data instead of the app or screen activity tracking common for desk-based teams.
How Often Should I Check My Crew Performance Dashboard?
Review active job status daily. Check profitability and completion trends weekly, since those numbers need a few days of data to show a meaningful pattern.
Can Small Service Businesses with Only a Few Crews Benefit from a Dashboard?
Yes. Even 2-3 crews make manual tracking unreliable quickly. A dashboard scales naturally as you add crews, so setting it up early saves a painful transition later.
Do I Need Separate Dashboards for Different Trades Like Electrical, Plumbing, or Landscaping?
No. One platform can serve multiple trades as long as job types and metrics are customizable per crew, which is common for general contractors managing varied trades under one roof.