
The result? Double-booked jobs. Invoices that go out weeks late. No real answer to the question "which jobs actually make us money?" That chaos quietly eats into profit every single week.
This guide breaks down the different types of field service metrics, the KPIs that actually matter, maintenance-specific numbers for equipment-heavy trades, and how to track all of it without piling more admin work onto your office team. Whether you run HVAC, plumbing, electrical, landscaping, or a commercial cleaning crew, the same core principles apply.
KEY TAKEAWAYS
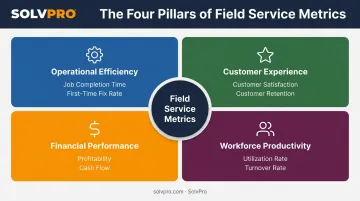
- Field service metrics fall into four categories: efficiency, customer experience, financials, and workforce productivity
- A focused set of KPIs, like first-time fix rate and job profitability, drives more impact than tracking dozens of vanity numbers
- Maintenance KPIs like MTTR and MTBF help prevent equipment failures and missed SLAs
- Purpose-built field service software automates metric tracking, cutting manual reporting for office staff
- A metric changes behaviour only when someone owns it, so each KPI needs a named reviewer and a review cadence
What Are Field Service Metrics? Metrics vs. KPIs Explained
A field service metric is a quantifiable measure of an activity or outcome. Time to complete a job. Cost per job. Miles driven per technician per week. There are dozens you could measure.
A KPI (Key Performance Indicator) is different. It's a metric your business has decided matters enough to track regularly, usually on a dashboard, and it's tied directly to a specific goal — improving cash flow, boosting crew accountability, or increasing repeat business.
Here's why the distinction matters for a growing service business:
- Tracking everything leads to data overload and analysis paralysis
- Office staff waste hours compiling reports nobody reads
- A focused set of KPIs tied to actual growth goals drives real decisions
For example, if cash flow is your biggest headache, service-to-cash rate becomes a KPI you check weekly, not just a metric buried in a report.
The Main Types of Field Service Performance Metrics
Most field service metrics fall into four categories. Understanding these groups helps you pick metrics that actually match your goals, instead of chasing numbers just because they're easy to pull from software.
Operational & Service Efficiency Metrics
These measure how effectively work gets done. Common examples include:
- Job completion time (average hours per job type)
- Travel time between job sites
- First-time fix rate (jobs closed without a return visit)
Together, they determine how many jobs a crew can realistically complete in a day, which sets the ceiling on your revenue capacity.
Customer Experience Metrics
These reflect how customers feel about the service they received. Satisfaction scores and retention rates live in this bucket. They tie directly to referrals and repeat business, one of the cheapest ways a trades business can generate new revenue.
Financial & Business Performance Metrics
This is the money side: revenue per job, profitability, and cash flow. Most owners care about this category more than any other, even if they don't formally track it. Without clean data here, you're guessing at your own margins, and a single underpriced job can wipe out a week's profit.
Workforce & Technician Metrics
These measure crew productivity and accountability — utilization rate, turnover, jobs per technician. They help identify training gaps, scheduling problems, or crew members who consistently outperform (or underperform) the rest of the team.
Key Field Service KPIs Every Manager Should Track
Within those four categories, a handful of KPIs consistently matter most for field service managers, regardless of trade.
Efficiency KPIs to Watch
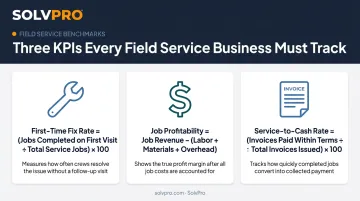
First-Time Fix Rate (FTFR) measures the percentage of jobs completed without needing a follow-up visit:
FTFR = Jobs completed on first visit ÷ Total jobs
This is one of the most-cited efficiency benchmarks in field service. Aberdeen Group's research on 156 field service organizations found an overall average FTFR of 75%, while best-in-class organizations hit 89%. Laggards fell to just 56%. A low FTFR usually points to poor parts availability, inadequate technician training, or incomplete job information before dispatch.
Jobs Completed Per Day is straightforward:
Jobs Completed Per Day = Total jobs ÷ Number of days
A low number often signals scheduling or routing inefficiencies rather than a slow crew. Technicians spending more time driving than working is a routing problem, not a productivity problem.
Average Response/Travel Time tracks how long it takes a technician to reach a job site. GPS-based dispatching and route planning tools shrink this number by assigning the closest available crew instead of the next one on a static list — reducing windshield time and squeezing more billable hours into the day.
Customer & Retention KPIs
Customer Satisfaction (CSAT) is typically measured through post-job surveys or review scores, often on a 1-5 or 1-10 scale. There isn't a universal benchmark specific to trades businesses, but it's worth tracking consistently over time rather than chasing a specific number. The trend matters more than any single score.
Customer Retention Rate measures loyalty:
Retention Rate = Customers retained ÷ Total customers
Retention numbers vary significantly by trade. In landscaping, for instance, a 2026 Lawn & Landscape survey of 320 businesses reported average customer retention of 88% in 2024 and 89% in 2025. That's a useful benchmark if you run recurring-service contracts.
Financial & Growth KPIs
Job Profitability is the number most owners actually want to know:
Job Profitability = Revenue − Costs
Tracking this per job, not just as a company-wide average, reveals which services or crews are genuinely profitable. A crew that finishes fast but burns through materials might look productive while dragging down margins.
Service-to-Cash Rate measures the time between job completion and payment received. This one hits differently for growing crews: the longer that gap, the harder it is to cover payroll and material costs on the next job.
This is exactly where SolvPro's mobile invoicing comes in. Crews can generate invoices and collect payment on-site the moment work wraps up, instead of waiting days or weeks for office paperwork to catch up.
Maintenance KPIs Every Field Service Team Should Track
For HVAC, refrigeration, and commercial maintenance contracts, a separate set of KPIs matters just as much as the ones above.
Mean Time to Repair (MTTR)
MTTR = Total repair time ÷ Number of repairs
A high MTTR signals technician readiness problems or parts availability issues. If repairs consistently take longer than expected, it's worth auditing whether trucks are stocked with the right parts before dispatch.
Mean Time Between Failures (MTBF)
MTBF = Total uptime ÷ Number of failures
Better equipment quality or stronger installation practices typically produce a longer MTBF. Tracking this metric over time helps you flag underperforming equipment brands or installation crews before they become a pattern.
Contract/Equipment Uptime and SLA Compliance
These track whether maintenance agreements and service-level promises are being met. For commercial HVAC and refrigeration contracts, missing an SLA can trigger penalty clauses or lost contract renewals.
Preventive vs. Reactive Maintenance Ratio
Increasing the share of preventive work lowers long-term costs and reduces emergency callouts. The U.S. Department of Energy's facility maintenance guide estimates preventive maintenance saves 12% to 18% compared to reactive maintenance, with predictive maintenance saving another 8% to 12% on top of that. Shifting even a portion of reactive work to scheduled preventive visits pays off quickly.
How to Track & Improve Your Field Service Metrics
Manually tracking metrics through spreadsheets or paper is the single biggest barrier for growing service businesses. It leads to inconsistent data and incomplete records, with decisions often made weeks after the fact, once the problem has already cost you money.
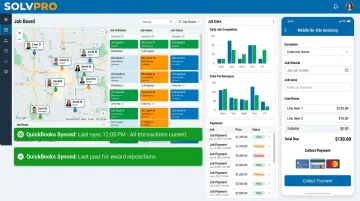
Integrated field service management software solves this differently. Instead of asking office staff to compile reports after the fact, it captures job times and technician activity automatically, in real time, along with invoicing details, as the work happens.
SolvPro was built to close this exact gap, through features like:
- Event-based geolocation tracking geo-stamps time entries, photo uploads, and status updates the moment they happen, giving crew accountability without constant GPS pinging
- QuickBooks Online sync feeds labor hours, material costs, and job revenue straight into your accounting system, keeping job profitability numbers accurate without manual re-entry
- Setup takes under 10 minutes, with no long-term contract and no credit card required to start
- On-site invoicing and payment collection shortens the service-to-cash rate by letting crews bill and collect before they even leave the job site
With accurate data now flowing in automatically, the next step is deciding where to focus. If you're just getting started, don't try to monitor everything at once. Pick 3 to 5 KPIs tied to your biggest current pain point.
- Cash flow tight? Start with service-to-cash rate.
- Crews arguing about whereabouts? Start with utilization and travel time.
- Not sure if jobs are profitable? Start with job profitability, tracked per job.
Expand from there once those numbers are consistently accurate.
Frequently Asked Questions
What Are the Key KPIs for Field Service Managers?
The top manager-level KPIs are first-time fix rate, job profitability, customer satisfaction, and technician utilization. Together, they cover efficiency, money, and crew accountability in one snapshot.
What Types of Performance Metrics Are Used in Field Service Management?
Field service metrics fall into four categories: operational efficiency, customer experience, financial performance, and workforce productivity. Most businesses pull KPIs from all four rather than focusing on just one.
What Maintenance KPIs Should Field Service Teams Track?
The core maintenance KPIs are Mean Time to Repair (MTTR), Mean Time Between Failures (MTBF), and contract or equipment uptime against SLA targets. These matter most for equipment-heavy operations like environmental services, commercial cleaning, and multi-crew maintenance contracts.
How Often Should Field Service Metrics Be Reviewed?
Operational metrics like response time and jobs completed per day are best reviewed weekly. Financial and retention metrics, like job profitability or customer retention rate, are typically reviewed monthly or quarterly.
What's the Difference Between a Field Service Metric and a KPI?
All KPIs are metrics, but not all metrics are KPIs. A KPI is a metric your business chooses to track closely because it's tied to a core goal, like cash flow or crew accountability.
How Does Field Service Software Help Track These Metrics Automatically?
Platforms like SolvPro capture job data, timestamps, and payment status in real time as crews work in the field. This eliminates manual spreadsheet tracking and gives instant visibility into performance without extra admin work.